SST Analysis

Sea Surface Temperature Monitoring & ENSO Diagnostics

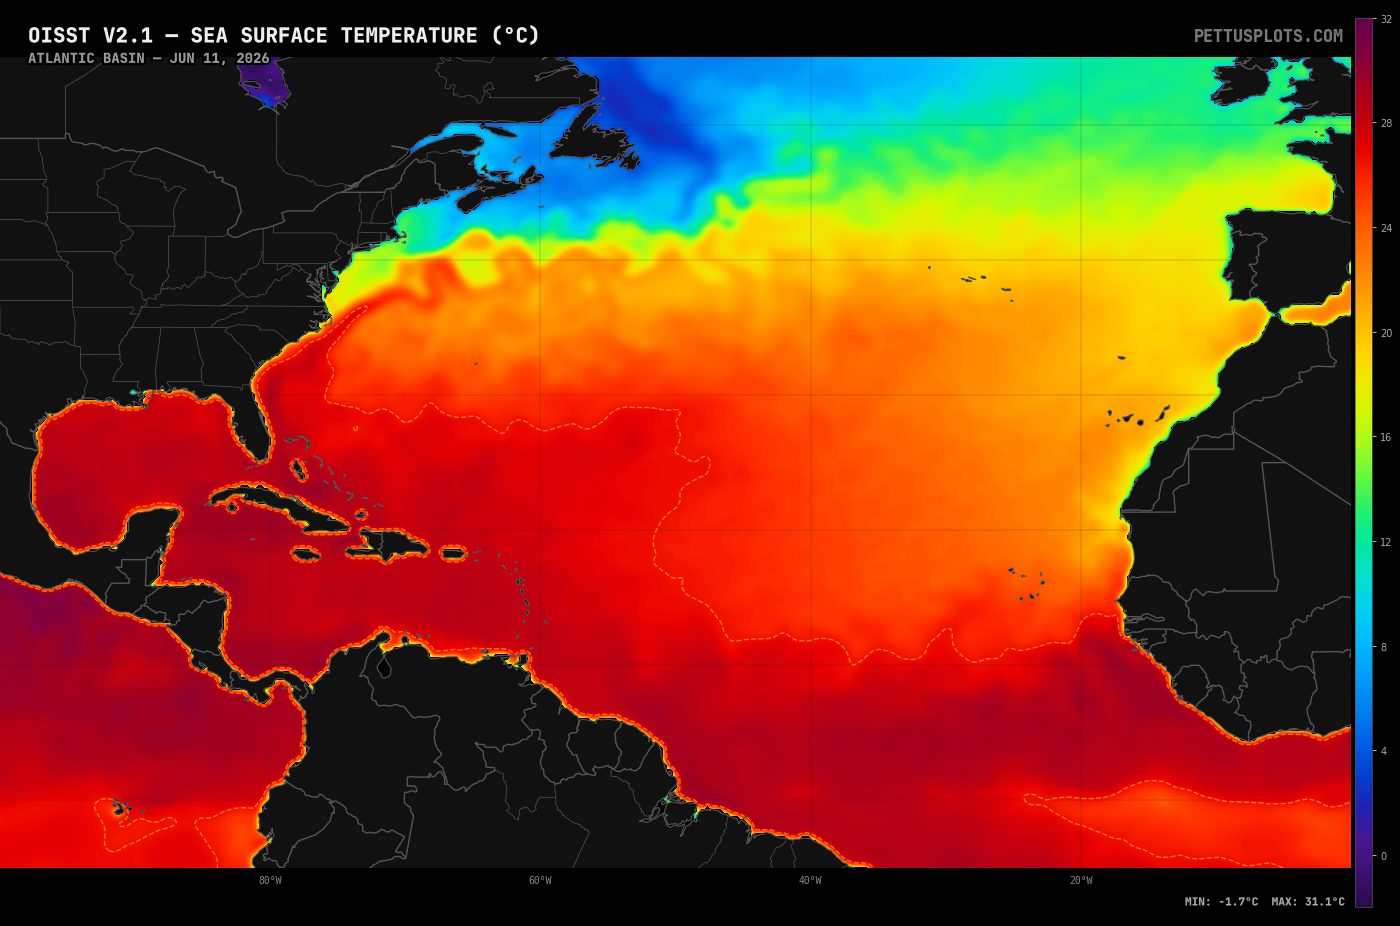
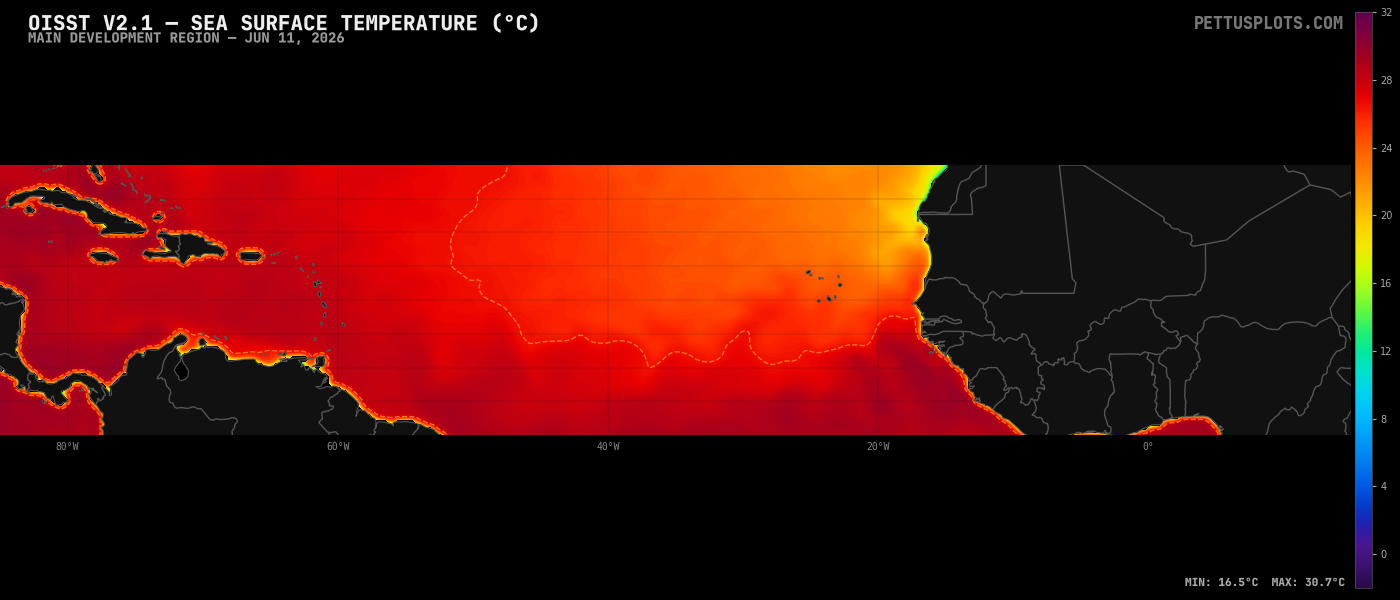
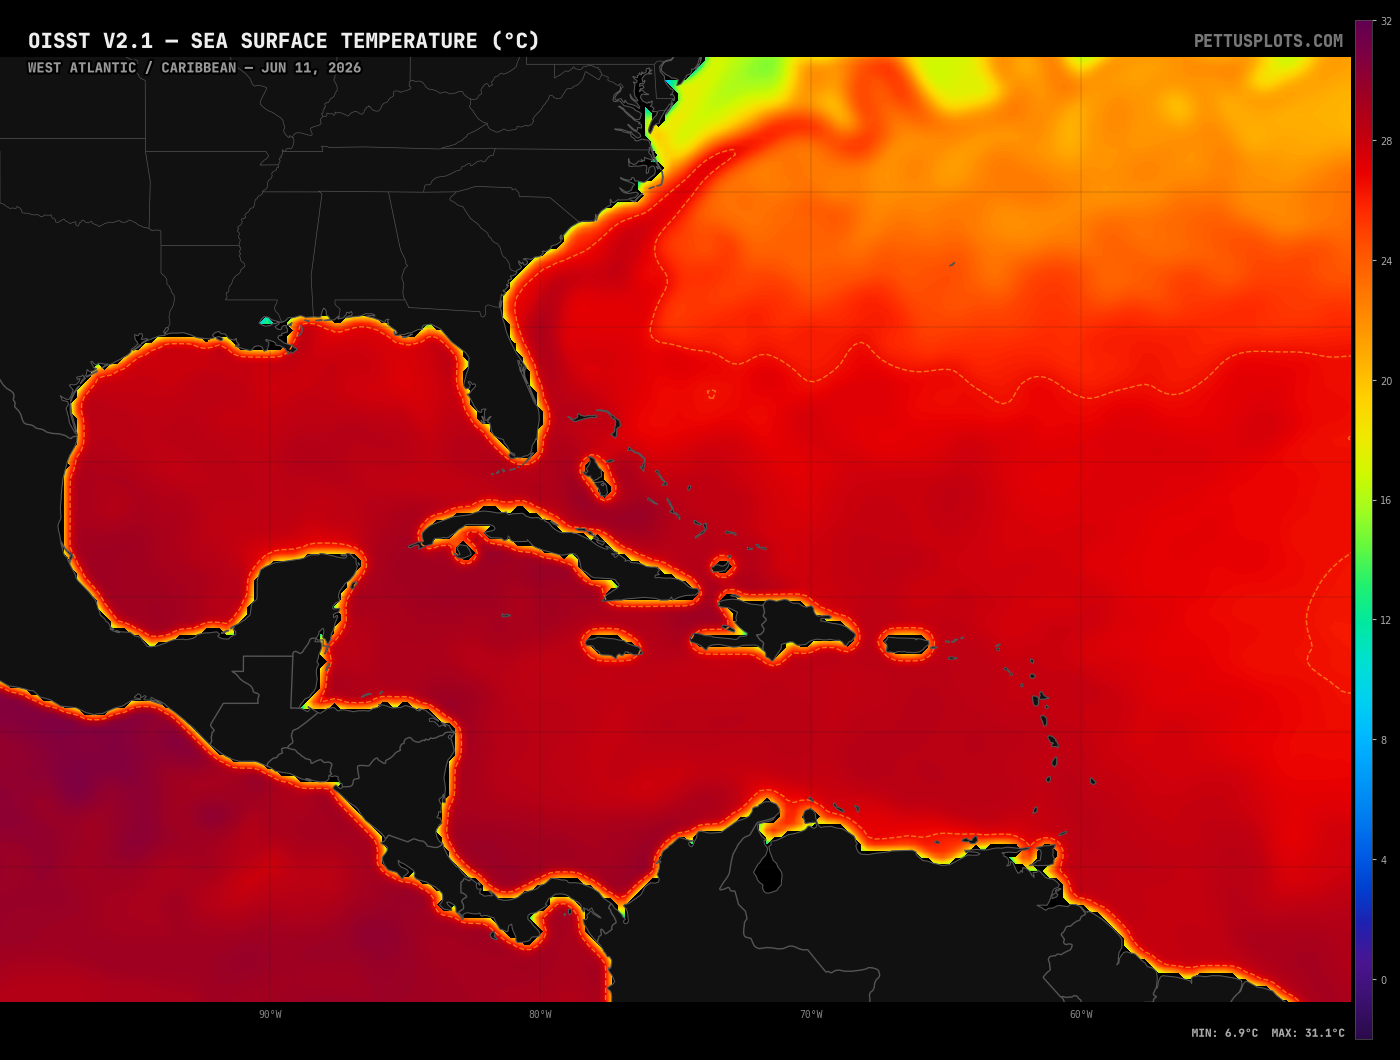
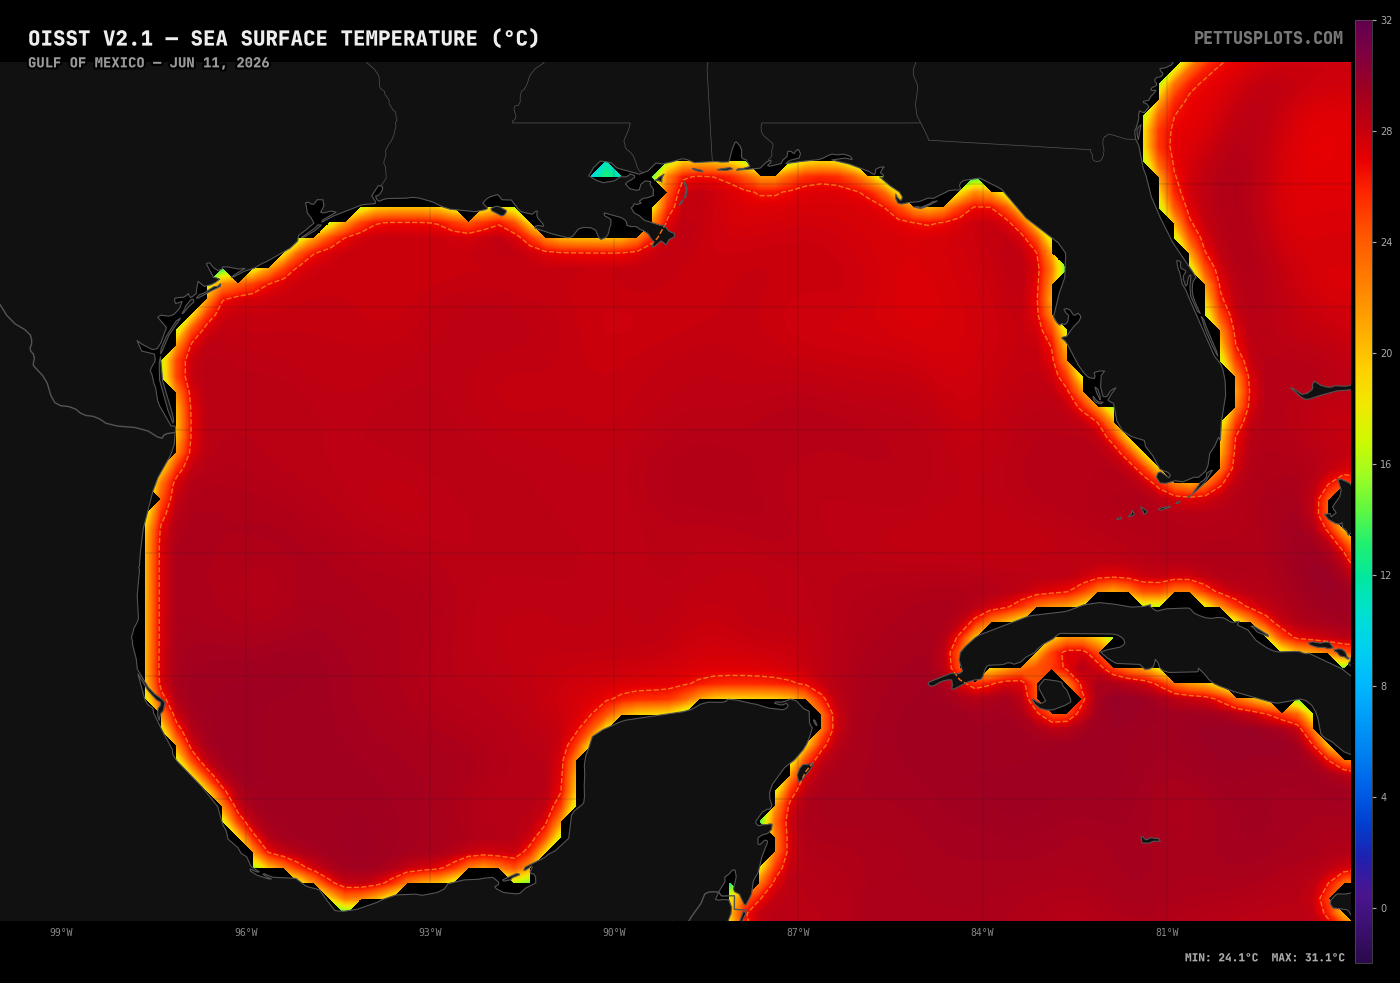
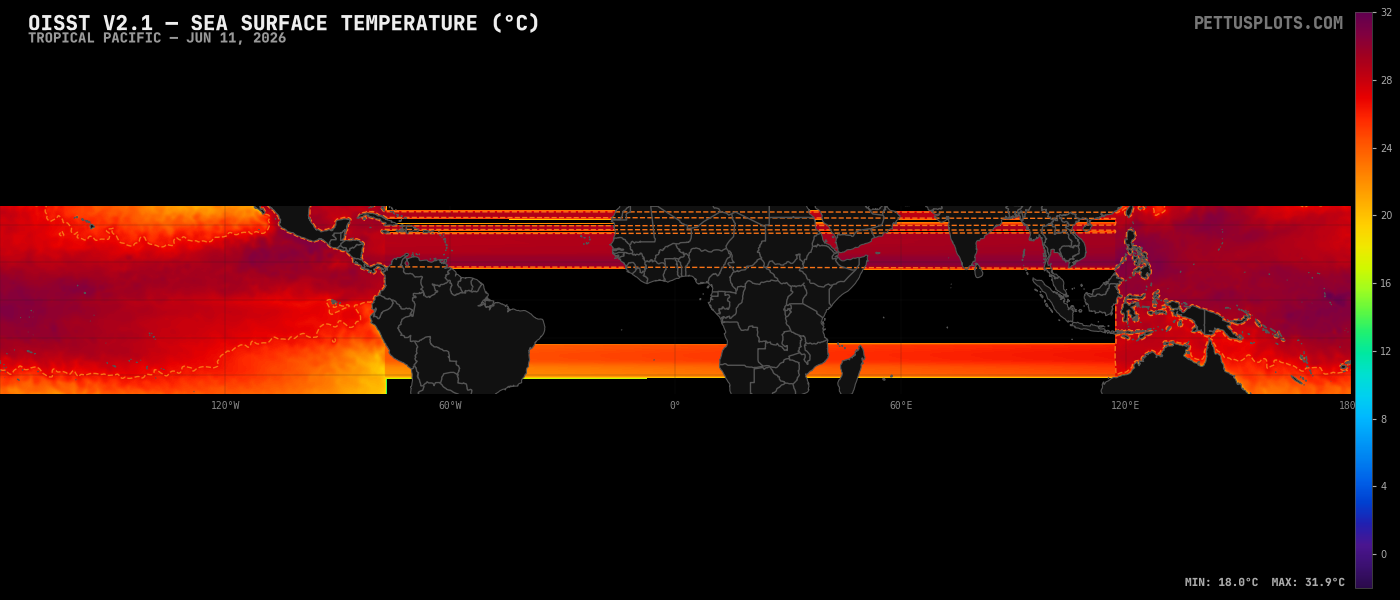
Global sea surface temperature analysis from NOAA OISST satellite data, plotted by PettusPlots. SST is one of the most important variables for tropical cyclone development, ENSO monitoring, and seasonal forecasting. Water temperatures above 26.5C are generally required for tropical cyclogenesis.
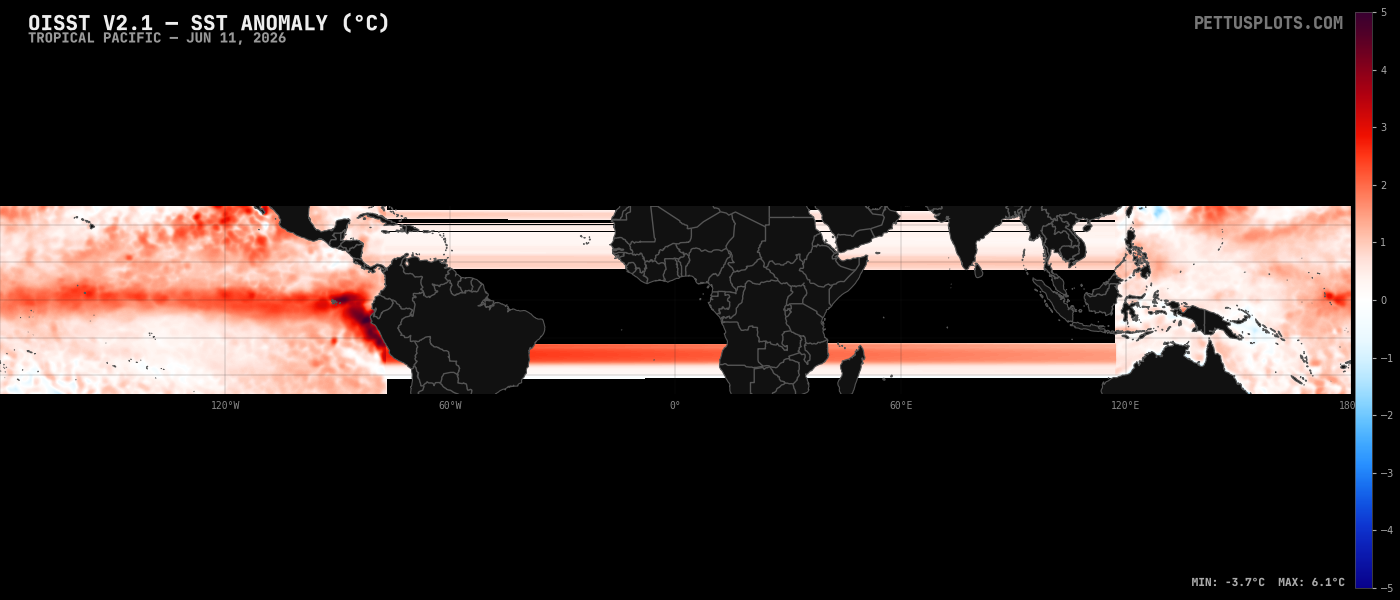
SST Maps

Product: Region:

Global Overview

Global SST OISST / PettusPlots
Global SST
Global SST Anomaly OISST / PettusPlots
Global SSTA

Key SST Time Series

Nino 3.4 SST Anomaly CPC / PettusPlots
Nino 3.4 Detail
Tropical Atlantic SST Anomaly CPC / PettusPlots
Tropical Atlantic SSTA

Annual Comparison

Nino 3.4 — Annual Overlay CPC / PettusPlots
Nino 3.4 Annual
Tropical Atlantic — Annual Overlay CPC / PettusPlots
Atlantic Annual

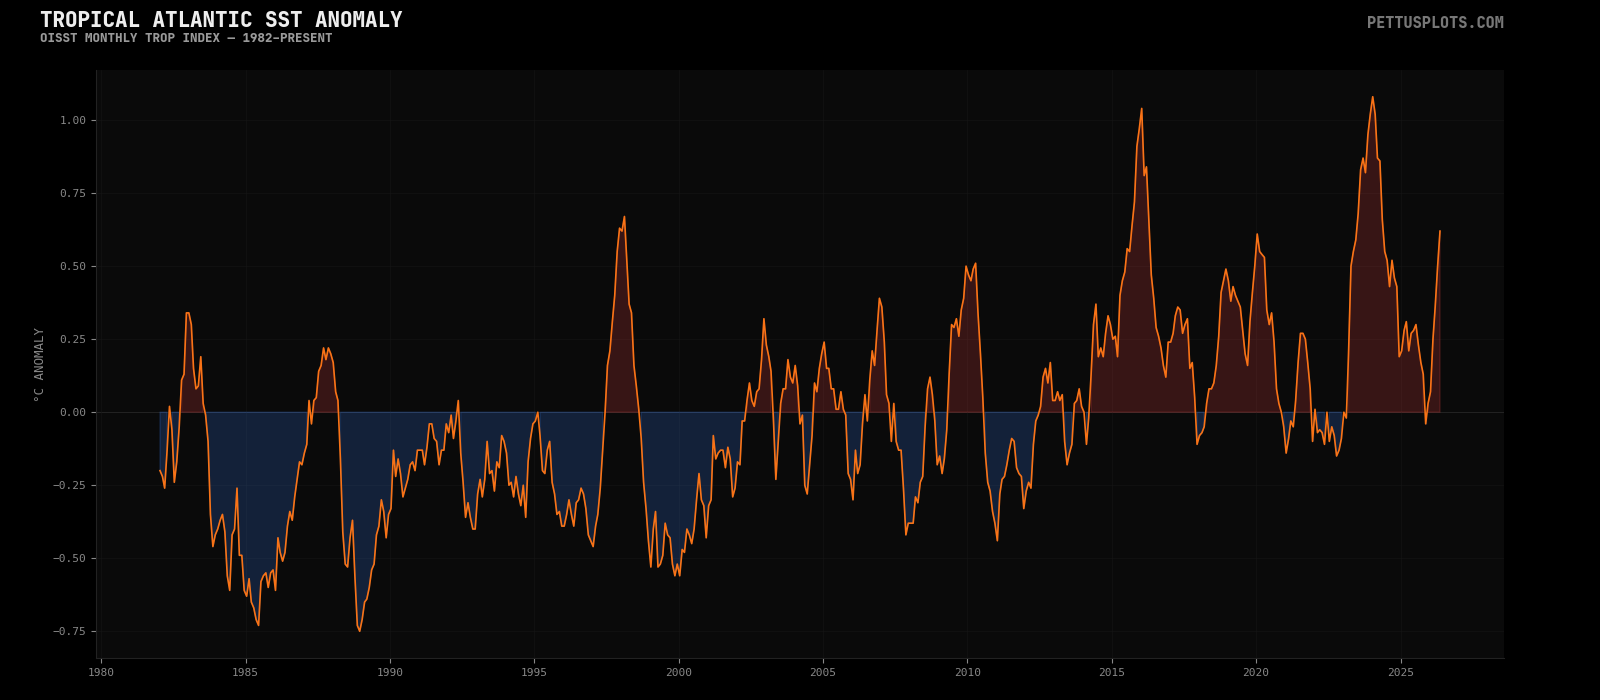
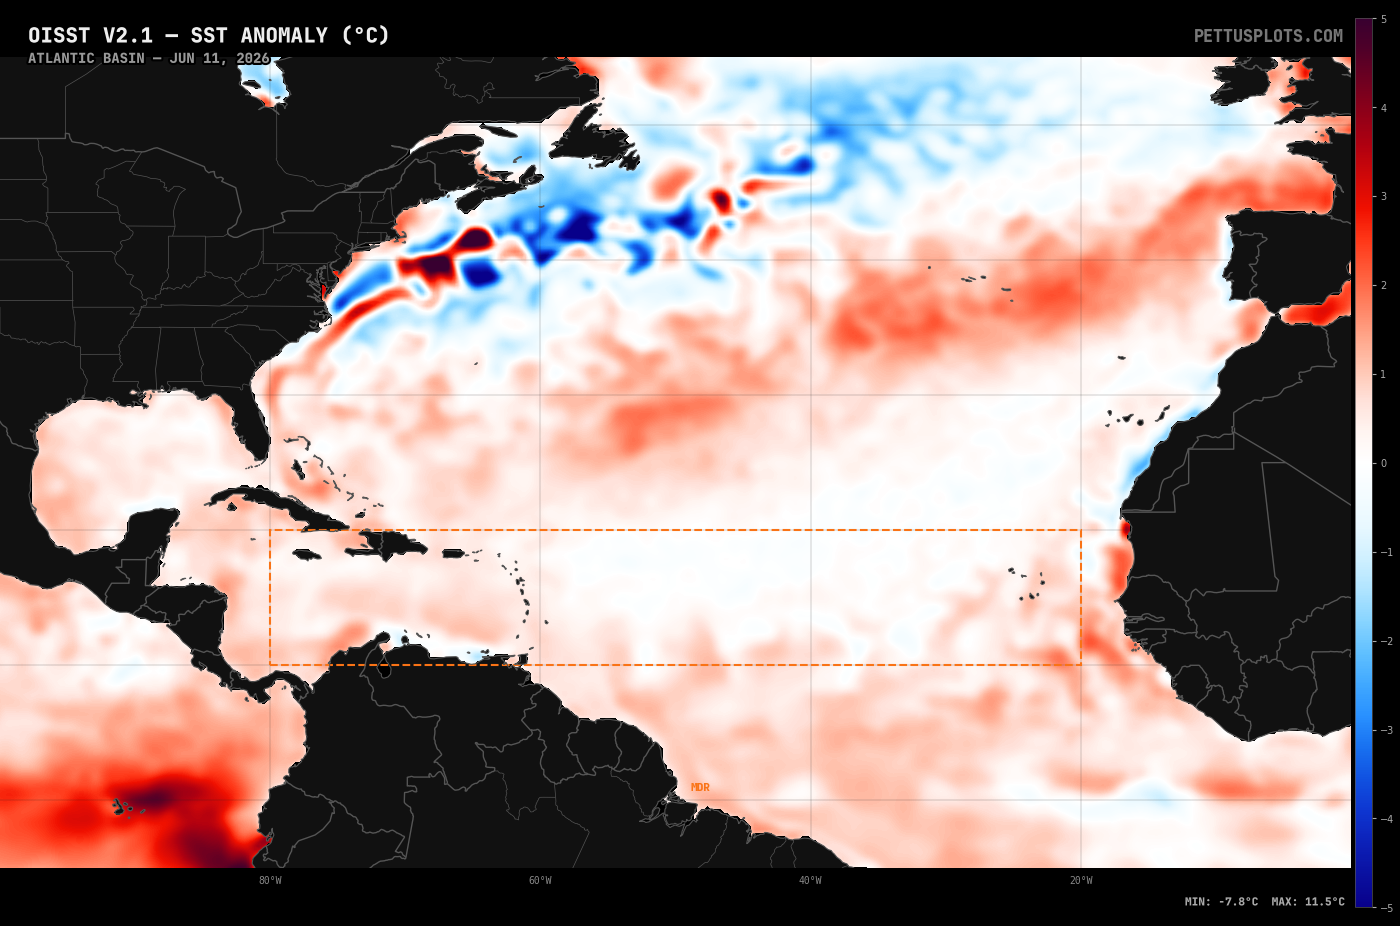
Tropical Atlantic SST monitoring focused on the Main Development Region (MDR) — the corridor from the West African coast to the Caribbean (10-20N, 20-80W) where the majority of Atlantic hurricanes form during peak season (Aug-Oct). Warmer-than-normal SSTs in the MDR strongly correlate with more active hurricane seasons.
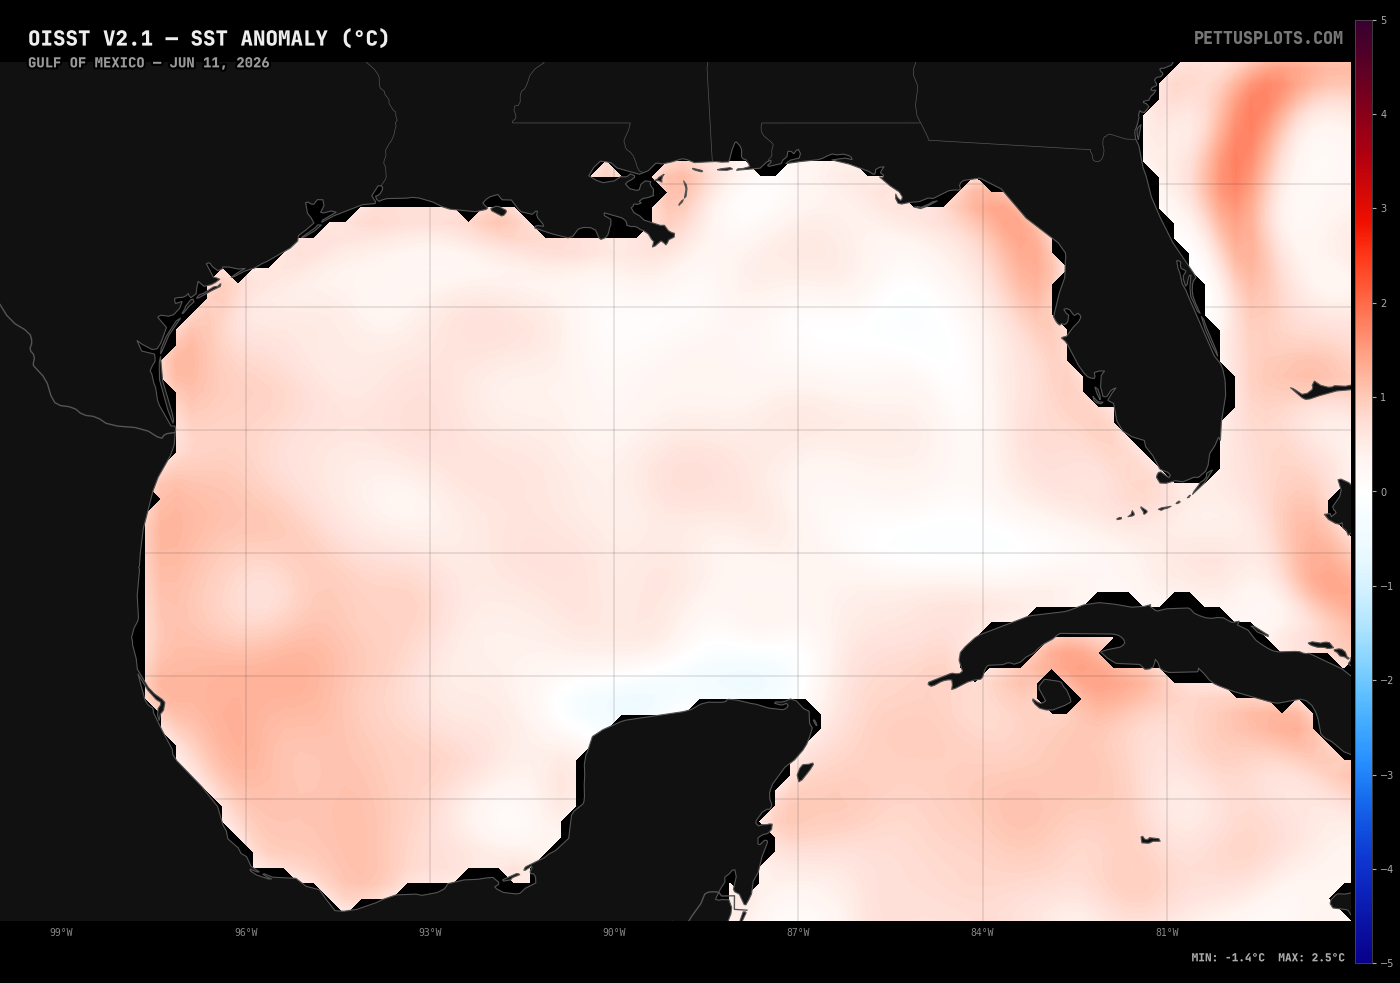
Atlantic SST Maps

Atlantic Basin SST OISST / PettusPlots
Atlantic SST
Atlantic Basin SST Anomaly OISST / PettusPlots
Atlantic SSTA
Main Development Region SST OISST / PettusPlots
MDR SST
Main Development Region SST Anomaly OISST / PettusPlots
MDR SSTA
West Atlantic / Caribbean SST OISST / PettusPlots
West Atlantic SST
West Atlantic / Caribbean SST Anomaly OISST / PettusPlots
West Atlantic SSTA
Gulf of Mexico SST OISST / PettusPlots
Gulf SST
Gulf of Mexico SST Anomaly OISST / PettusPlots
Gulf SSTA

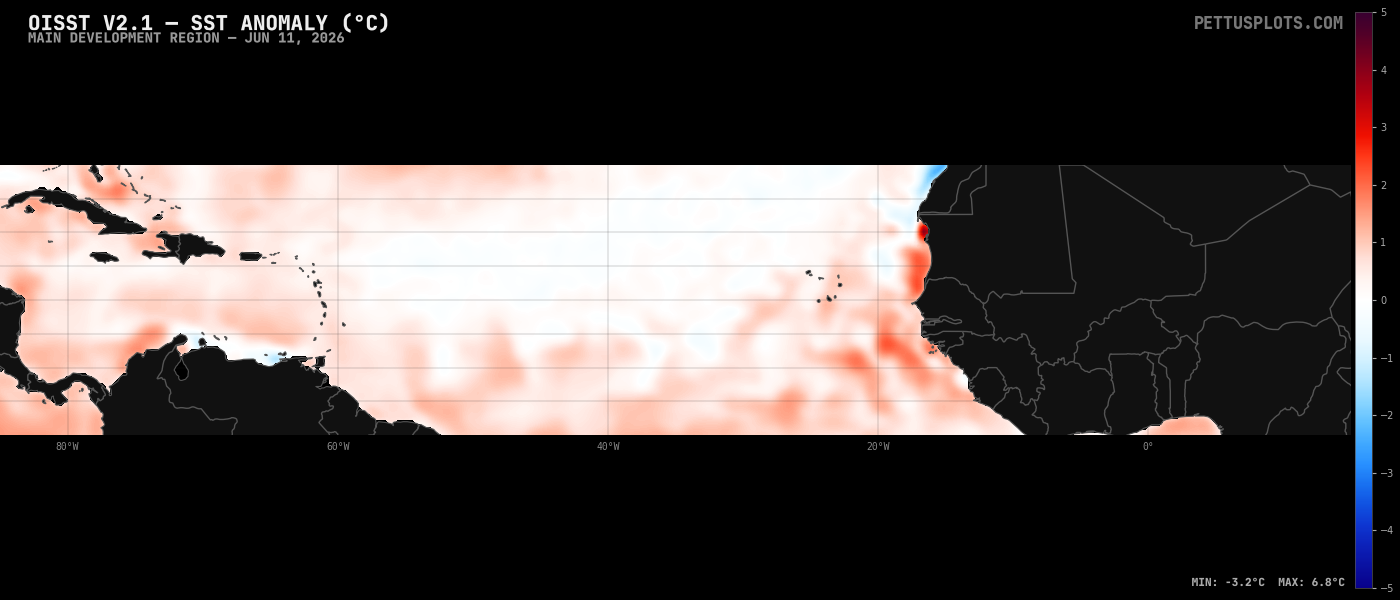
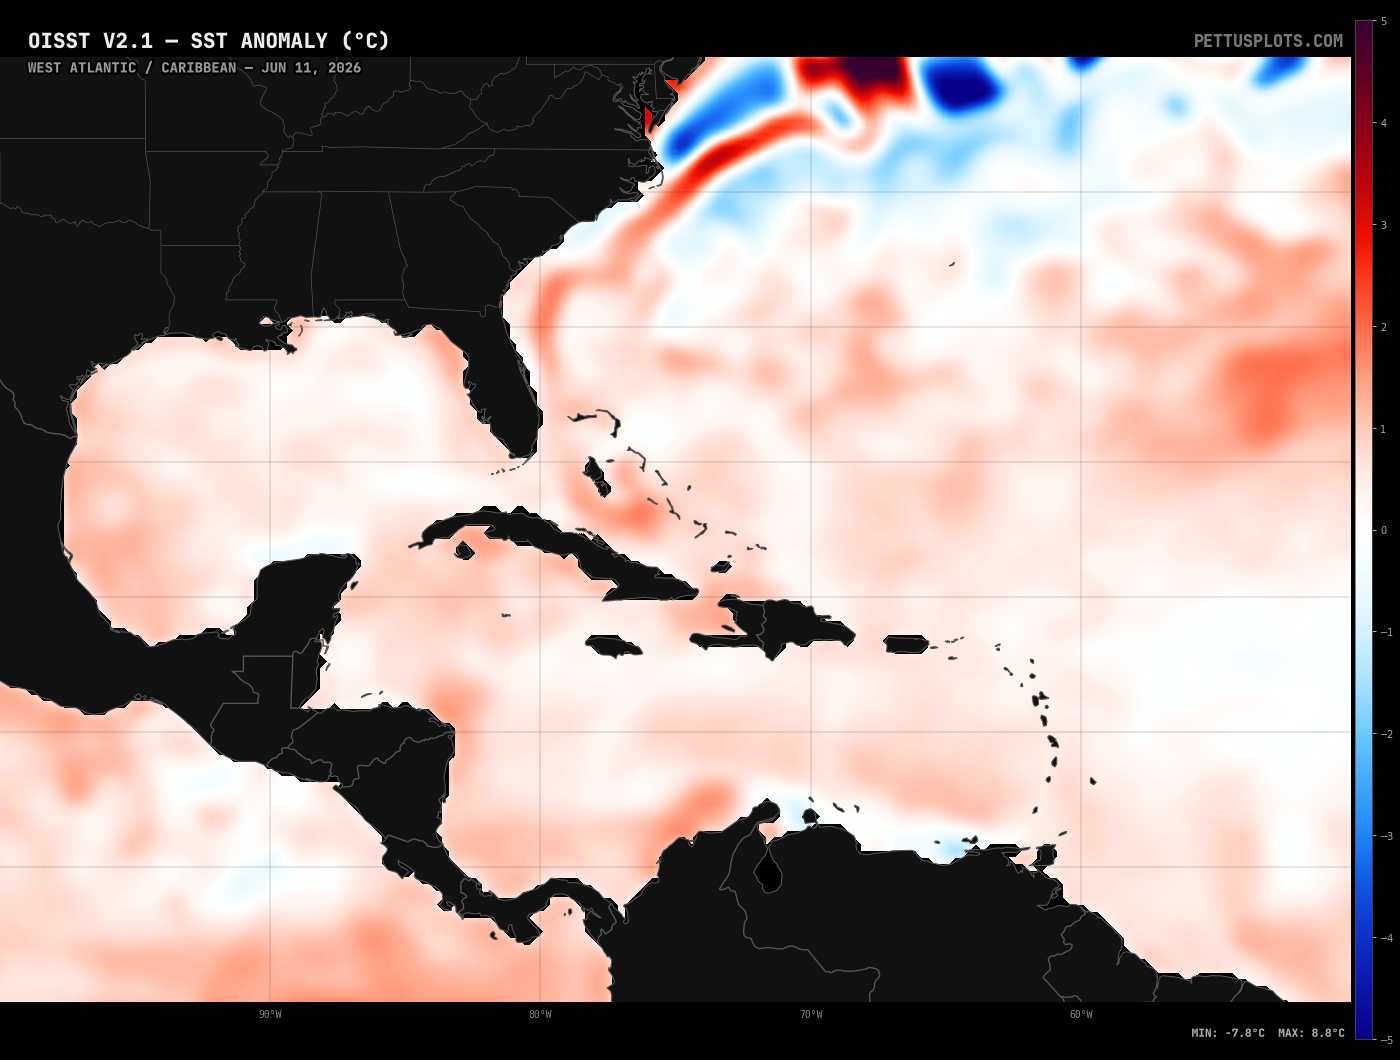
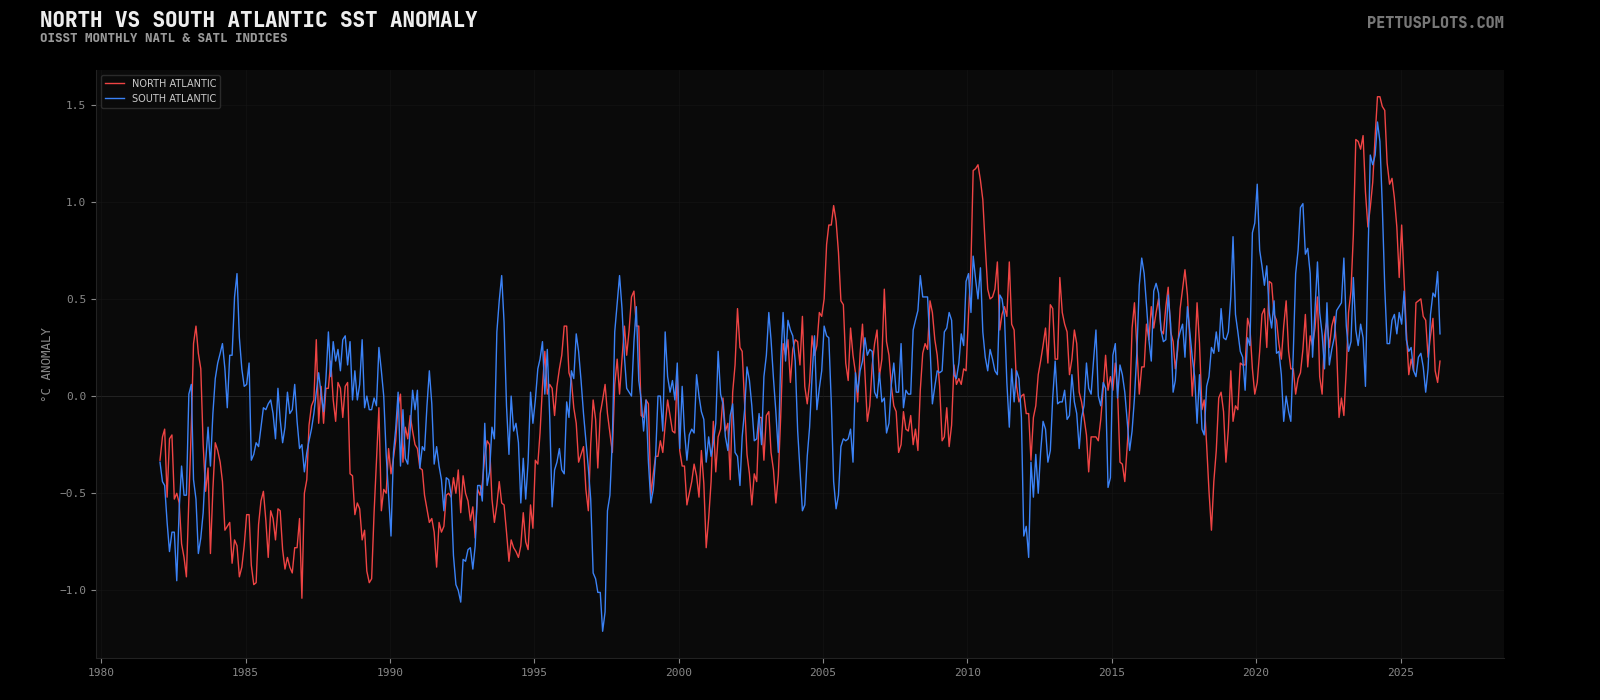
Atlantic Regional SST Indices

Tropical Atlantic SST Anomaly CPC / PettusPlots
Tropical Atlantic SSTA
North vs South Atlantic SST Anomaly CPC / PettusPlots
NATL vs SATL

Annual SST Comparison

Tropical Atlantic — Annual Overlay CPC / PettusPlots
Atlantic Annual Comparison

TC Development Factors

Tropical cyclone development requires more than warm SSTs. Low wind shear, sufficient mid-level moisture, and deep warm water (high ocean heat content) are all critical ingredients. The Saharan Air Layer (SAL) can suppress development by introducing dry, dusty air and increasing shear across the MDR.

Atlantic Tropical Cyclone Heat Potential NOAA AOML
TC Heat Potential
Atlantic Deep-Layer Wind Shear CIMSS
Wind Shear
Saharan Air Layer — Split Window CIMSS
SAL Split Window
Saharan Air Layer — Dust RGB CIMSS
SAL RGB

Upper-Ocean Heat Content

OSPO SST Anomaly OSPO
OSPO SSTA
OSPO HotSpot Analysis OSPO
OSPO HotSpot
Degree Heating Weeks — Atlantic OSPO
DHW

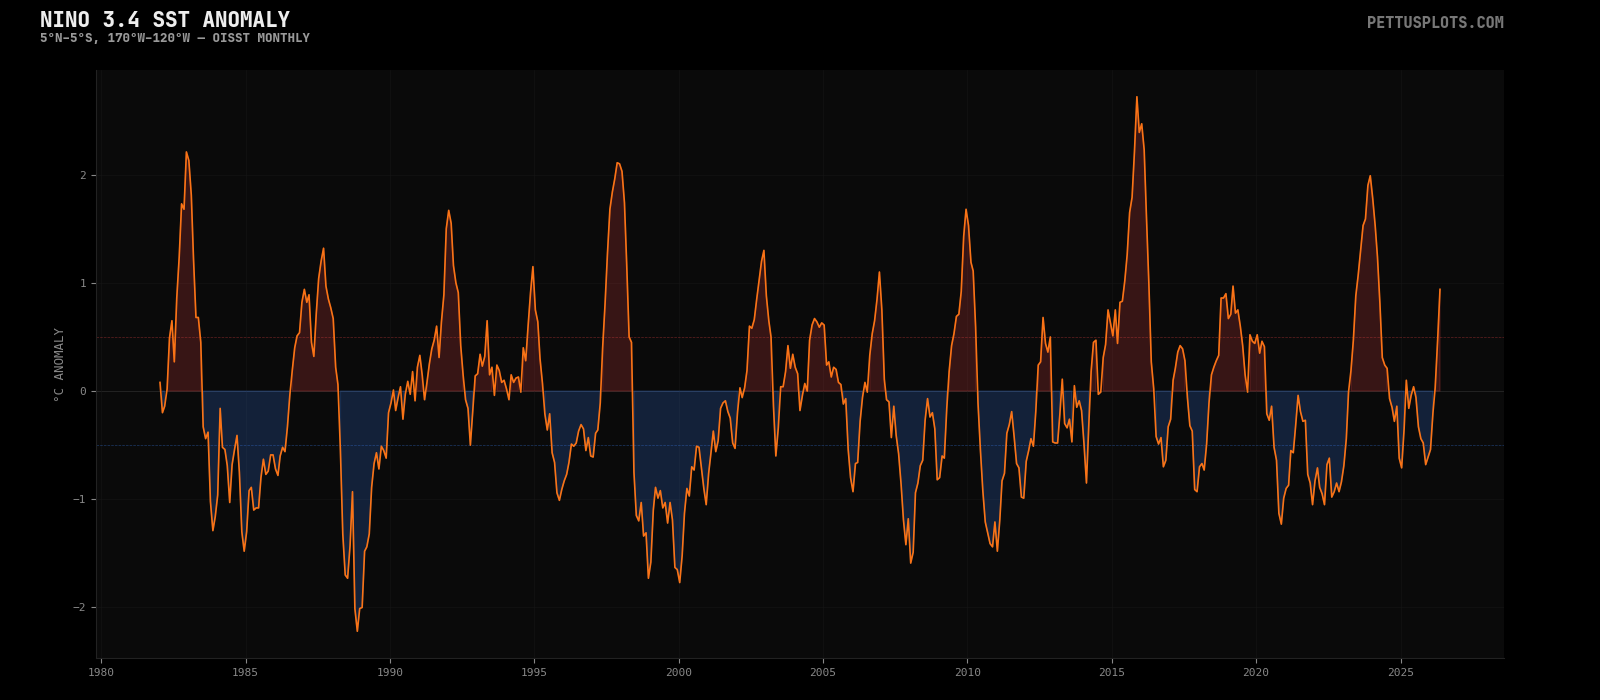
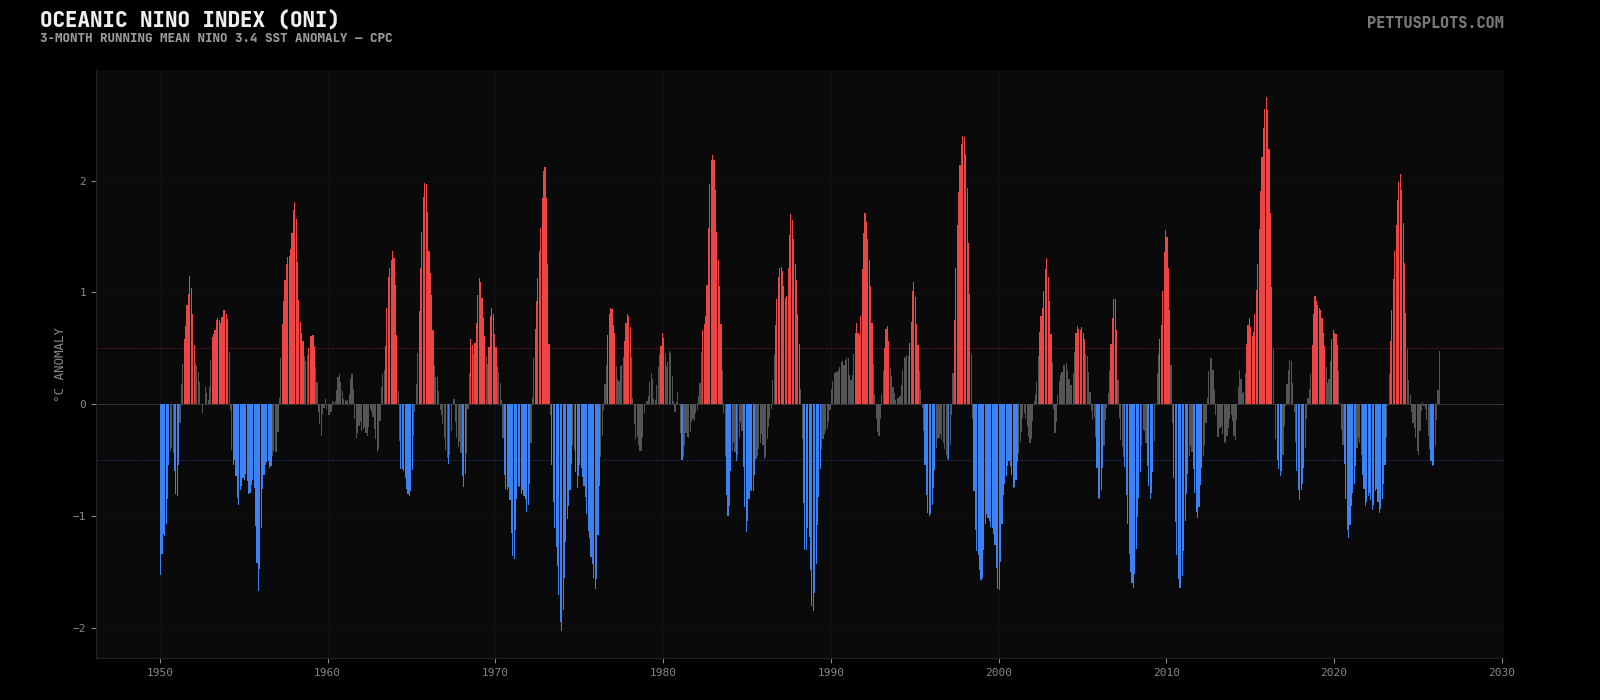
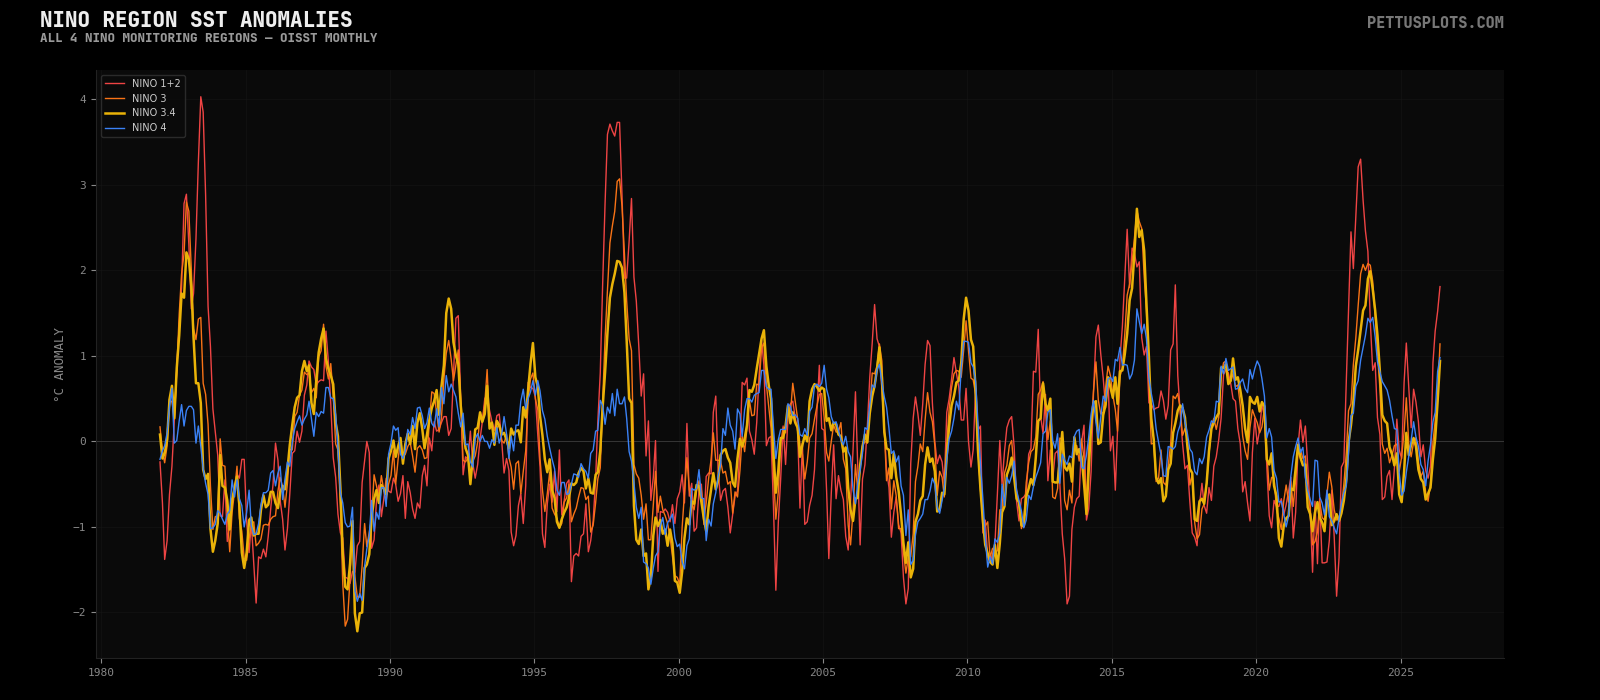
ENSO (El Nino-Southern Oscillation) is the dominant mode of tropical Pacific climate variability. El Nino features anomalously warm SSTs in the central/eastern tropical Pacific, suppressing Atlantic hurricane activity through increased wind shear. La Nina produces the opposite — cooler Pacific SSTs and typically more active Atlantic seasons.

Oceanic Nino Index (ONI)

ONI — 3-Month Running Mean Nino 3.4 Anomaly CPC / PettusPlots
ONI

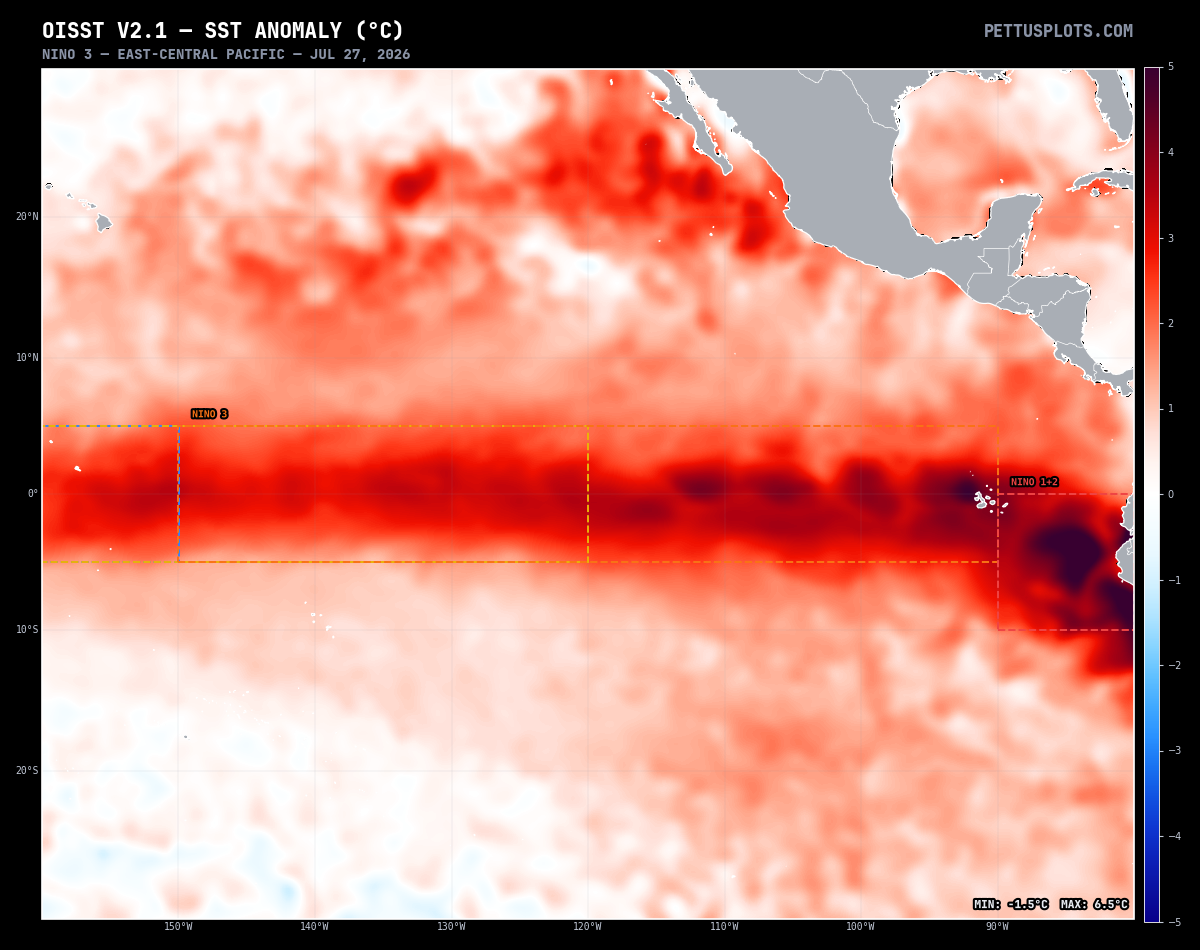
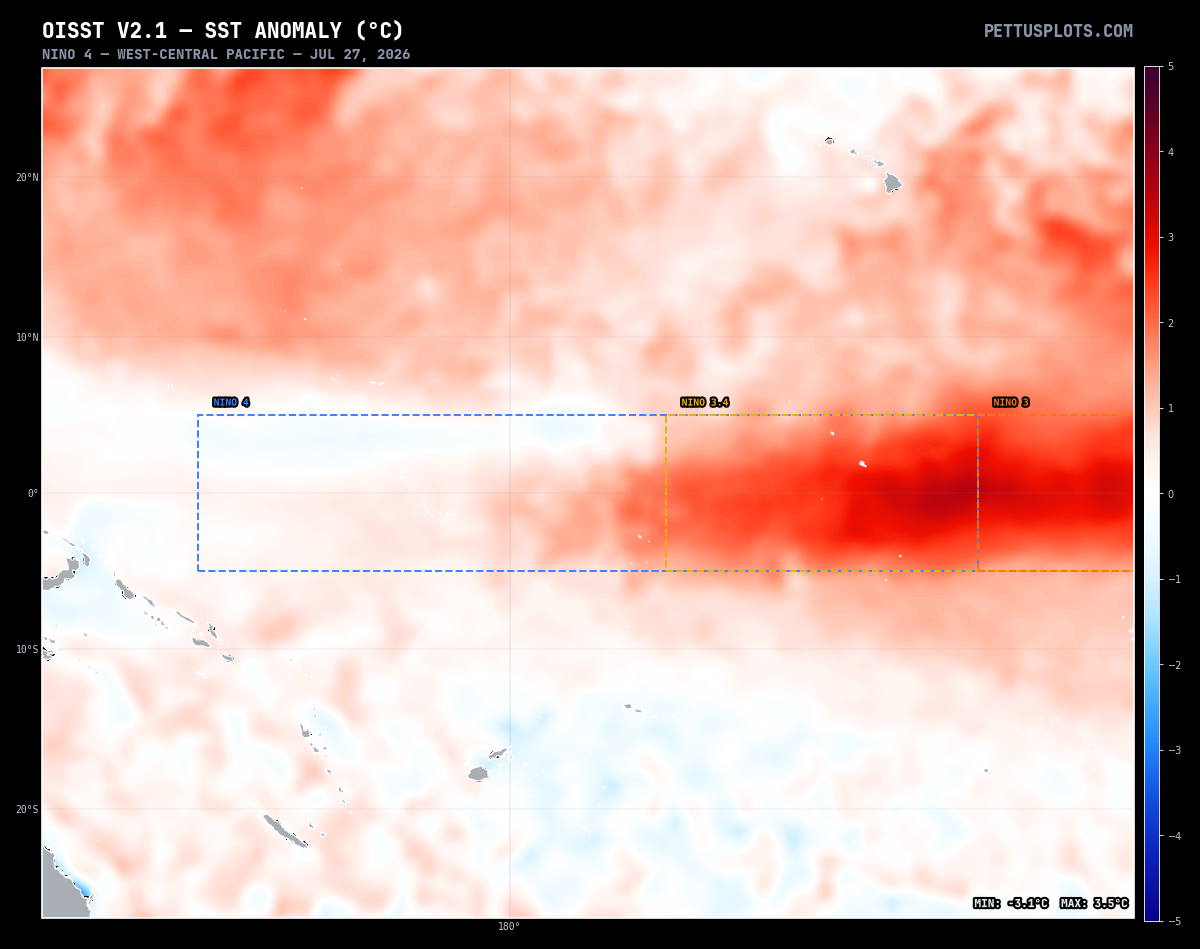
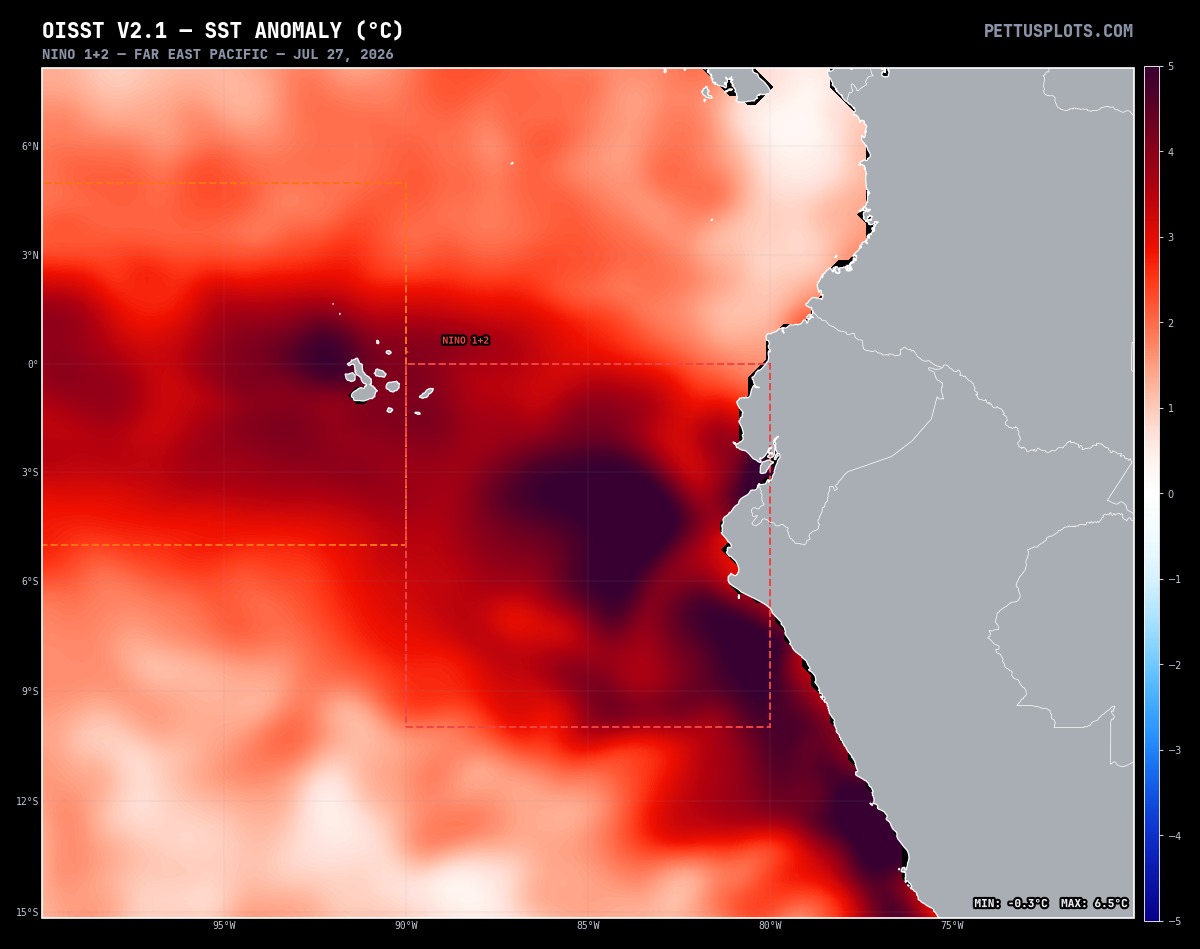
Nino Region SST Anomalies

All Nino Regions CPC / PettusPlots
Nino Regions
Nino 3.4 Region Detail CPC / PettusPlots
Nino 3.4

Nino 3.4 Annual Comparison

Nino 3.4 — Year-over-Year Overlay CPC / PettusPlots
Nino 3.4 Annual

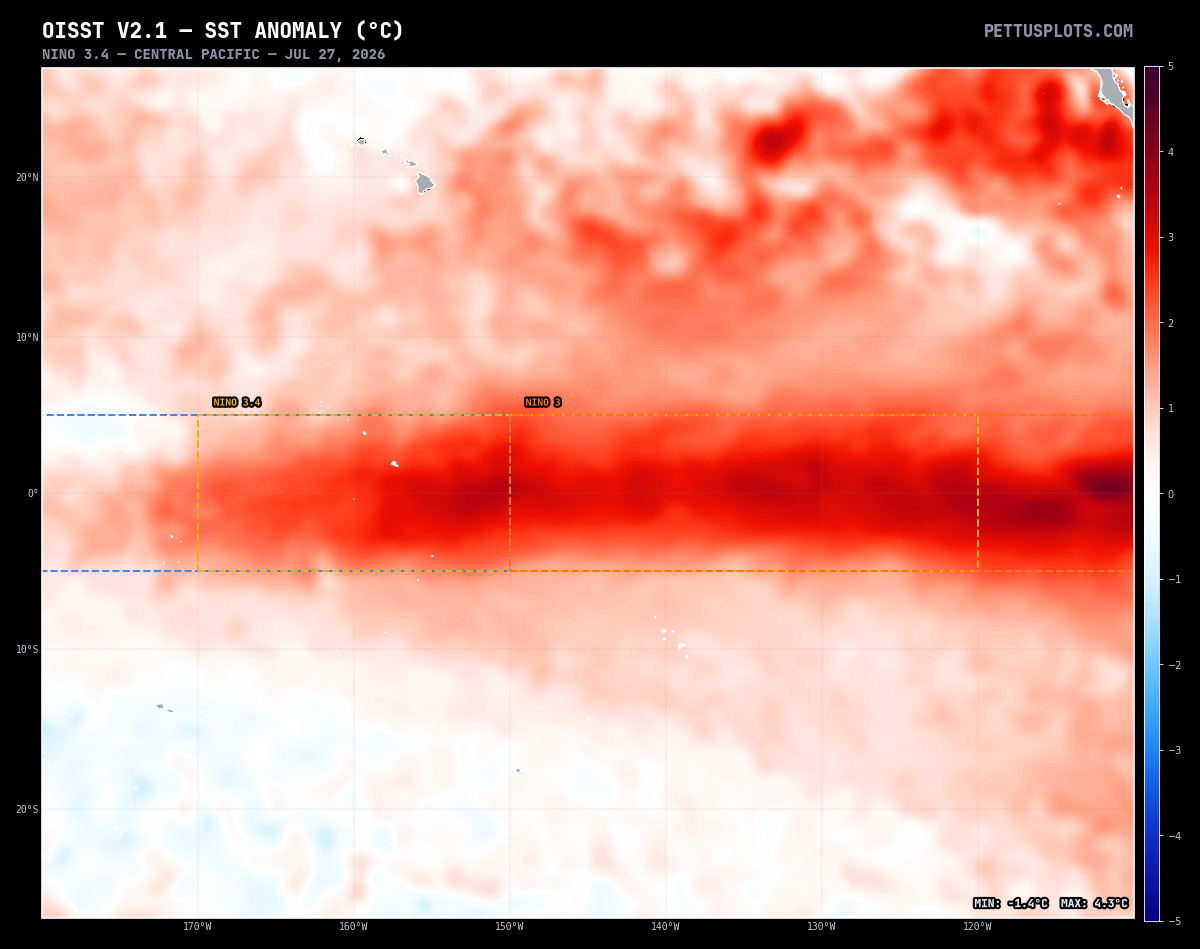
Tropical Pacific SST Maps

Tropical Pacific SST OISST / PettusPlots
Tropical Pacific SST
Tropical Pacific SST Anomaly OISST / PettusPlots
Tropical Pacific SSTA

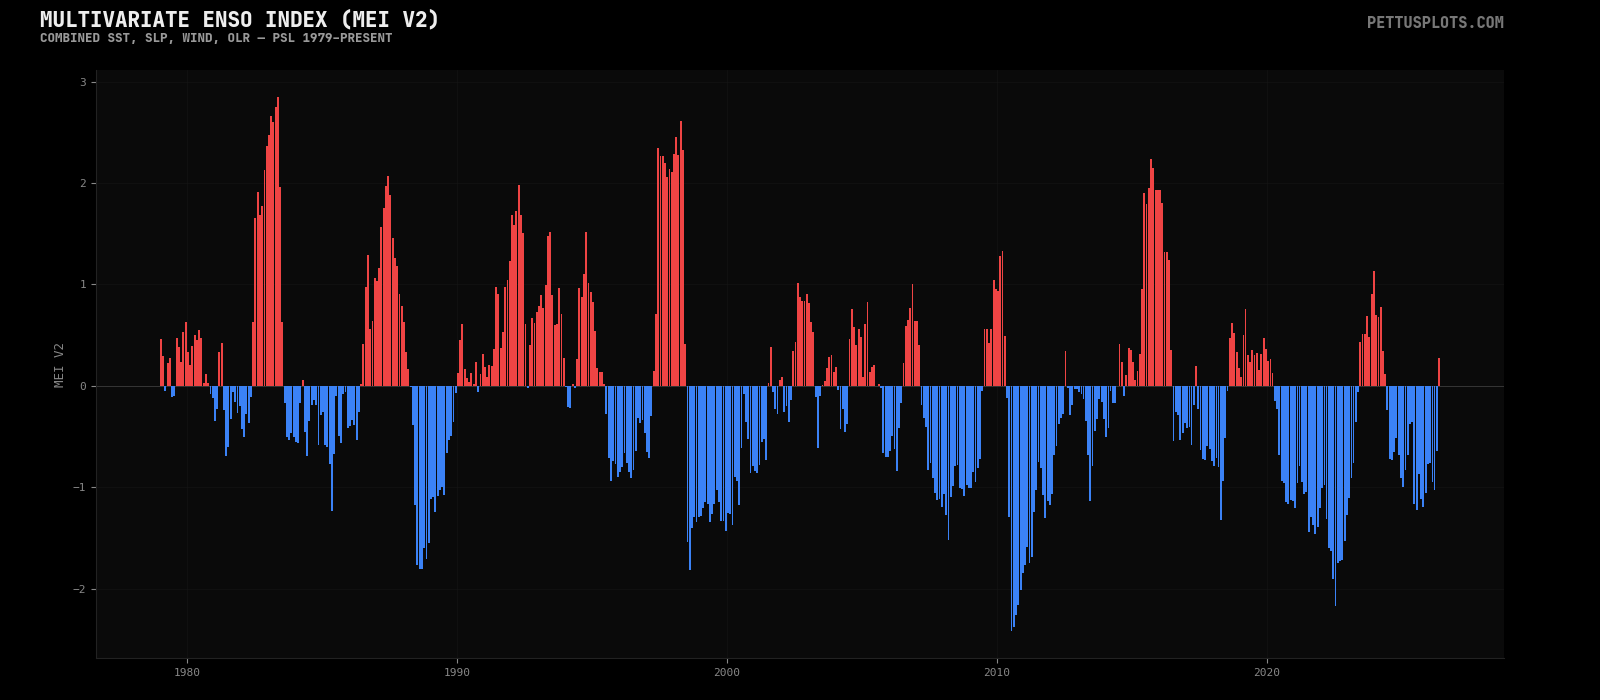
Multivariate ENSO Index (MEI v2)

MEI v2 Time Series PSL / PettusPlots
MEI v2

ENSO Forecast & Probability

ENSO Probability Forecast CPC
ENSO Probability
ENSO Strength Probability CPC
ENSO Strength

CFSv2 ENSO Forecast Plumes

Nino 3.4 Monthly Plume CFSv2
Nino 3.4 Monthly Plume
Nino 3.4 Seasonal Plume CFSv2
Nino 3.4 Seasonal Plume
Nino 3 Monthly Plume CFSv2
Nino 3 Plume
Nino 4 Monthly Plume CFSv2
Nino 4 Plume
Nino 1+2 Monthly Plume CFSv2
Nino 1+2 Plume
Global SST Seasonal Forecast CFSv2
Global SST Forecast

CPC Weekly ENSO Diagnostics

Weekly SST Anomalies CPC
Weekly SST Anomaly
Nino Region Anomaly Time Series CPC
Nino Region Time Series
SST & Climatology CPC
SST and Climatology
Tropical Pacific SST Animation CPC
SST Animation

CPC ENSO Discussion Figures

Figure 1 — SST Departures CPC
ENSO Fig 1
Figure 2 — SST Anomalies CPC
ENSO Fig 2
Figure 3 — Subsurface CPC
ENSO Fig 3
Figure 4 — Atmosphere CPC
ENSO Fig 4
Figure 5 — OLR CPC
ENSO Fig 5
Figure 6 — Forecasts CPC
ENSO Fig 6
Figure 7 — Temperature CPC
ENSO Fig 7
Figure 8 — Precipitation CPC
ENSO Fig 8

MJO Monitoring

The Madden-Julian Oscillation (MJO) is the dominant mode of intraseasonal tropical variability (30-60 day cycle). It modulates tropical convection, wind shear, and can trigger or suppress tropical cyclone development. Active MJO phases over the Atlantic/Caribbean (phases 1-2, 8) tend to favor TC genesis.

MJO Phase Diagram — Last 40 Days CPC
MJO Phase 40d
MJO Phase Diagram — Last 90 Days CPC
MJO Phase 90d
MJO Forecast CPC
MJO Forecast

East & West Pacific SST Maps

East Pacific SST OISST / PettusPlots
East Pacific SST
East Pacific SST Anomaly OISST / PettusPlots
East Pacific SSTA
West Pacific SST OISST / PettusPlots
West Pacific SST
West Pacific SST Anomaly OISST / PettusPlots
West Pacific SSTA

Indian Ocean SST

Indian Ocean SST OISST / PettusPlots
Indian Ocean SST
Indian Ocean SST Anomaly OISST / PettusPlots
Indian Ocean SSTA

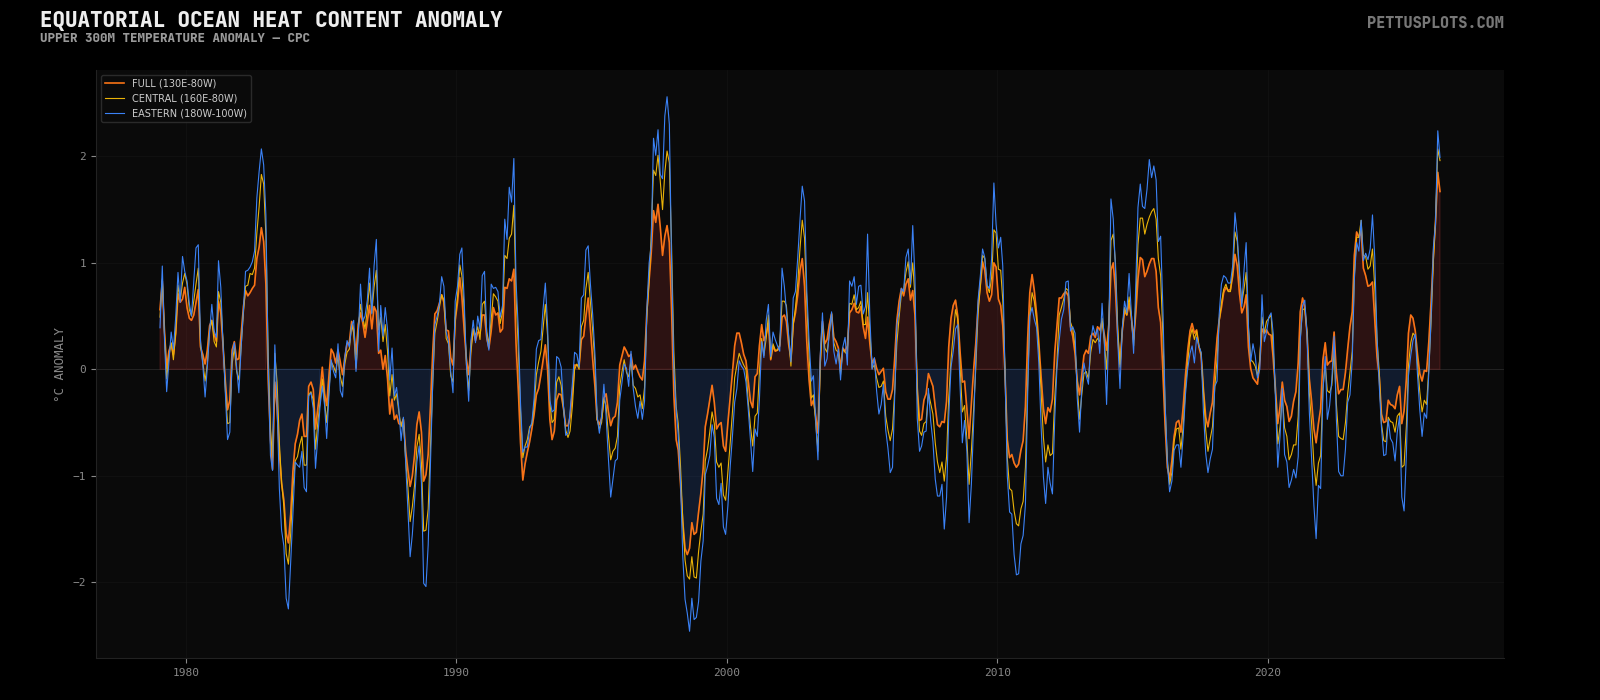
Subsurface ocean temperature structure reveals the full picture of ENSO evolution. Kelvin waves propagate warm/cool anomalies eastward along the equator, and the depth of the 20C isotherm (thermocline) indicates where warm water is pooling. Rising ocean heat content in the central Pacific often foreshadows El Nino development months in advance.

Equatorial Cross-Sections

Equatorial Temperature Cross-Section (Lon vs Depth) CPC
Equatorial Temperature Cross-Section
SST Anomaly Cross-Section (5N-5S) CPC
SSTA Cross Section

Thermocline (20C Isotherm)

20C Isotherm Depth CPC
20C Isotherm Depth
20C Isotherm Depth Anomaly CPC
20C Isotherm Anomaly

Depth Temperature Anomalies

55m Temperature Anomaly CPC
55m Temp Anomaly
105m Temperature Anomaly CPC
105m Temp Anomaly
155m Temperature Anomaly CPC
155m Temp Anomaly
Temperature Depth Anomaly Animation CPC
Depth Anomaly Animation

Sea Level & Heat Content

Sea Level Anomaly CPC
Sea Level Anomaly
Upper-Ocean Heat Anomalies (Past Year) CPC
Ocean Heat Anomalies

Ocean Heat Content Index

Equatorial Upper 300m Heat Content Anomaly CPC / PettusPlots
Heat Content

MEI Lifecycle

MEI v2 Lifecycle (Current Year) PSL
MEI Lifecycle Current
MEI v2 Lifecycle (All Years) PSL
MEI Lifecycle All

Hovmoller Diagrams

Hovmoller diagrams show how ocean conditions evolve over time along the equator. They reveal the propagation of Kelvin waves and subsurface warm/cool anomalies — key precursors to ENSO transitions. Eastward-propagating warm anomalies along the thermocline often signal developing El Nino conditions.

Equatorial Subsurface Temperature Anomaly — Hovmoller CPC
Subsurface Hovmoller
Pentad Mean SST (5N-5S) CPC
Pentad SST

Surface Current & Wind Anomalies

Equatorial Surface Current Anomaly CPC
Surface Current Anomaly
Equatorial Zonal Wind Anomaly CPC
Zonal Wind Anomaly

NOAA Coral Reef Watch uses satellite SST data to monitor coral bleaching risk worldwide. Degree Heating Weeks (DHW) accumulate thermal stress over 12 weeks — values above 4 indicate significant bleaching likely, above 8 indicates widespread mortality. These products are critical for monitoring marine ecosystem health in tropical waters.

CoralTemp SST Products

Region:

Bleaching Alert Products

OSPO Daily SST OSPO
Daily SST
OSPO Daily SST Anomaly OSPO
Daily SSTA
HotSpot OSPO
HotSpot
Degree Heating Weeks OSPO
DHW
Bleaching Alert Area OSPO
BAA